

Wavefront and Collimation
Take a few out-of-focus images of a bright star and BiggSky measures your telescope’s wavefront: a map of the error across the aperture, the aberrations that make it up, the Strehl ratio, the star image and contrast the optics can deliver, and which way to turn which screw when you collimate. It also checks the focuser: how far the star walks sideways as you focus, and how much backlash there is.
Full analysis: SSE Pro, DSO, Universe Collimation check: SSE Lite
An optical test bench from a star and your camera
A defocused star is a picture of your telescope’s aperture, and every collimation and figure error changes it in its own way. BiggSky fits a full diffraction model of your telescope — its aperture, central obstruction and spider — to the images until the model and the stars agree.
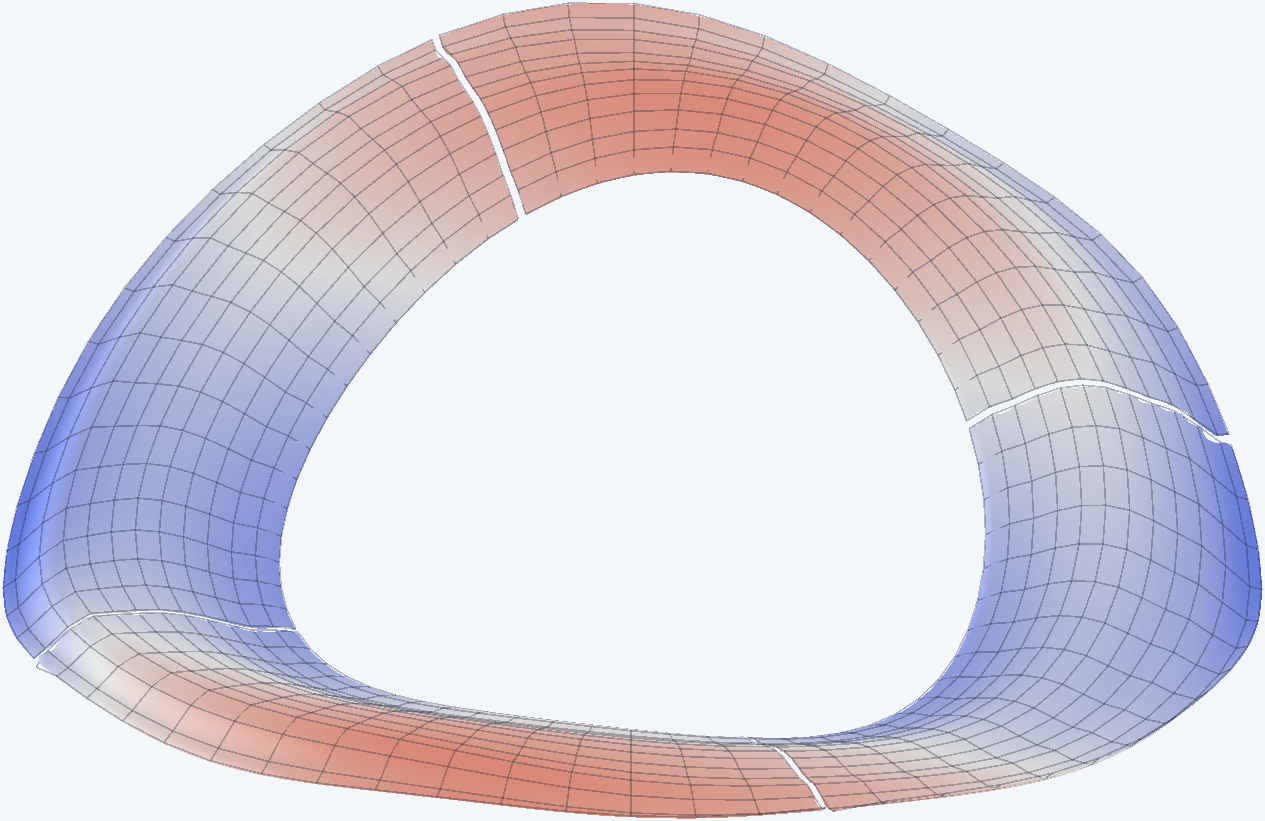
The wavefront
A map of the error across the aperture, in waves and nanometers, with its RMS and peak-to-valley, and a synthetic interferogram to compare with a bench test.
The aberrations
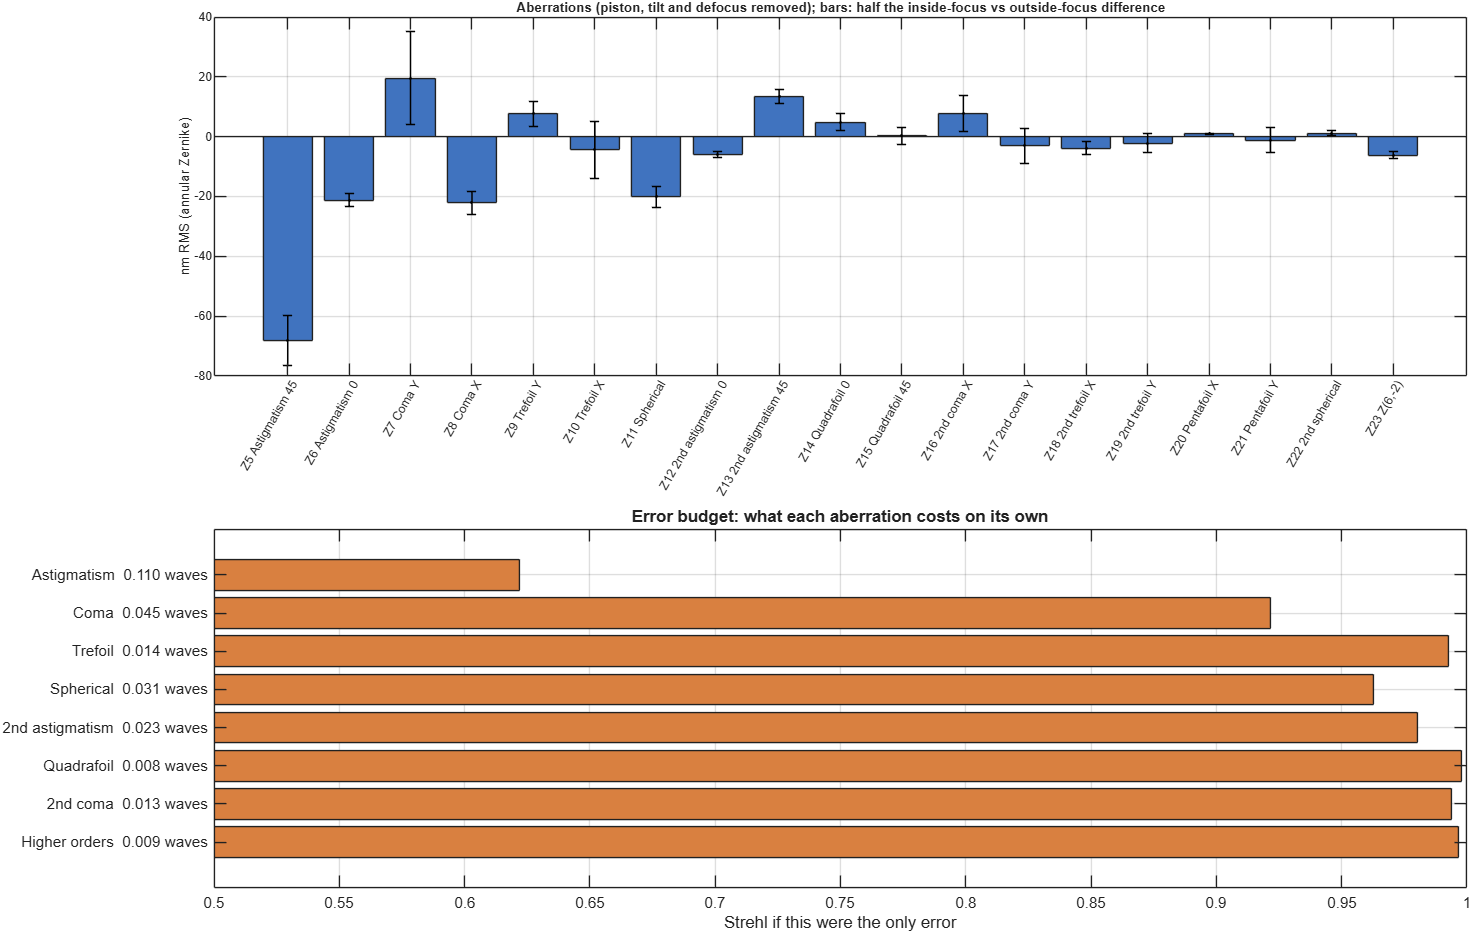
Astigmatism, coma, spherical, trefoil and higher terms as annular Zernike coefficients, each with what it alone costs in Strehl, and a ± from fitting each side of focus separately.
Image quality
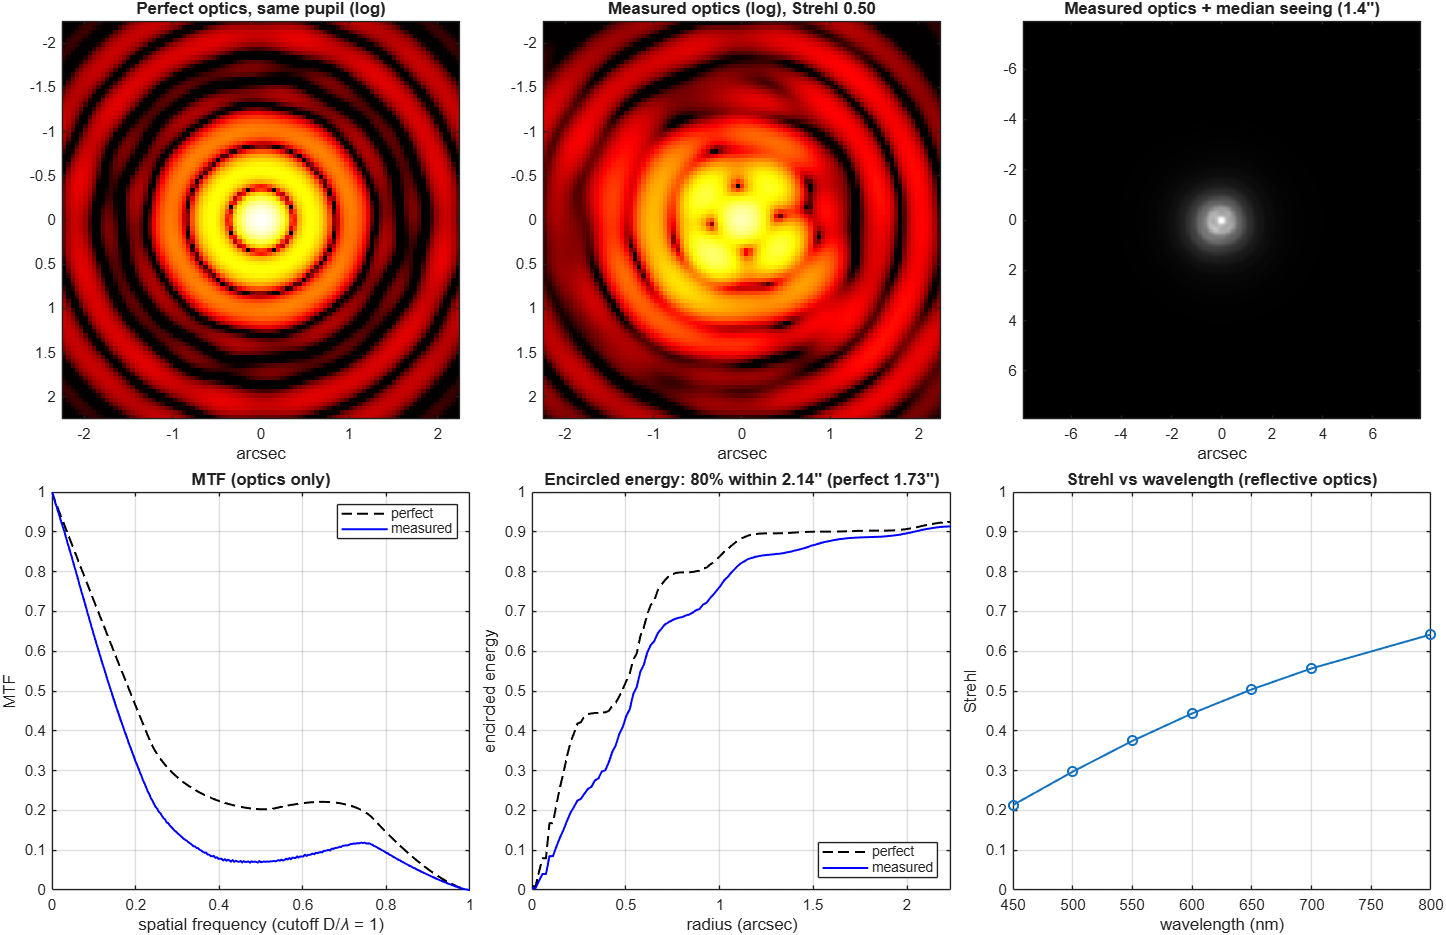
Strehl from 450 to 800 nm, the star image with and without the night’s seeing, the MTF that sets planetary contrast, encircled energy, and the depth of focus.
What to adjust
Which way the coma points (where the hole sits in an inside-focus donut), which way astigmatism stretches the star, and what each error usually means for your type of telescope.
The focuser
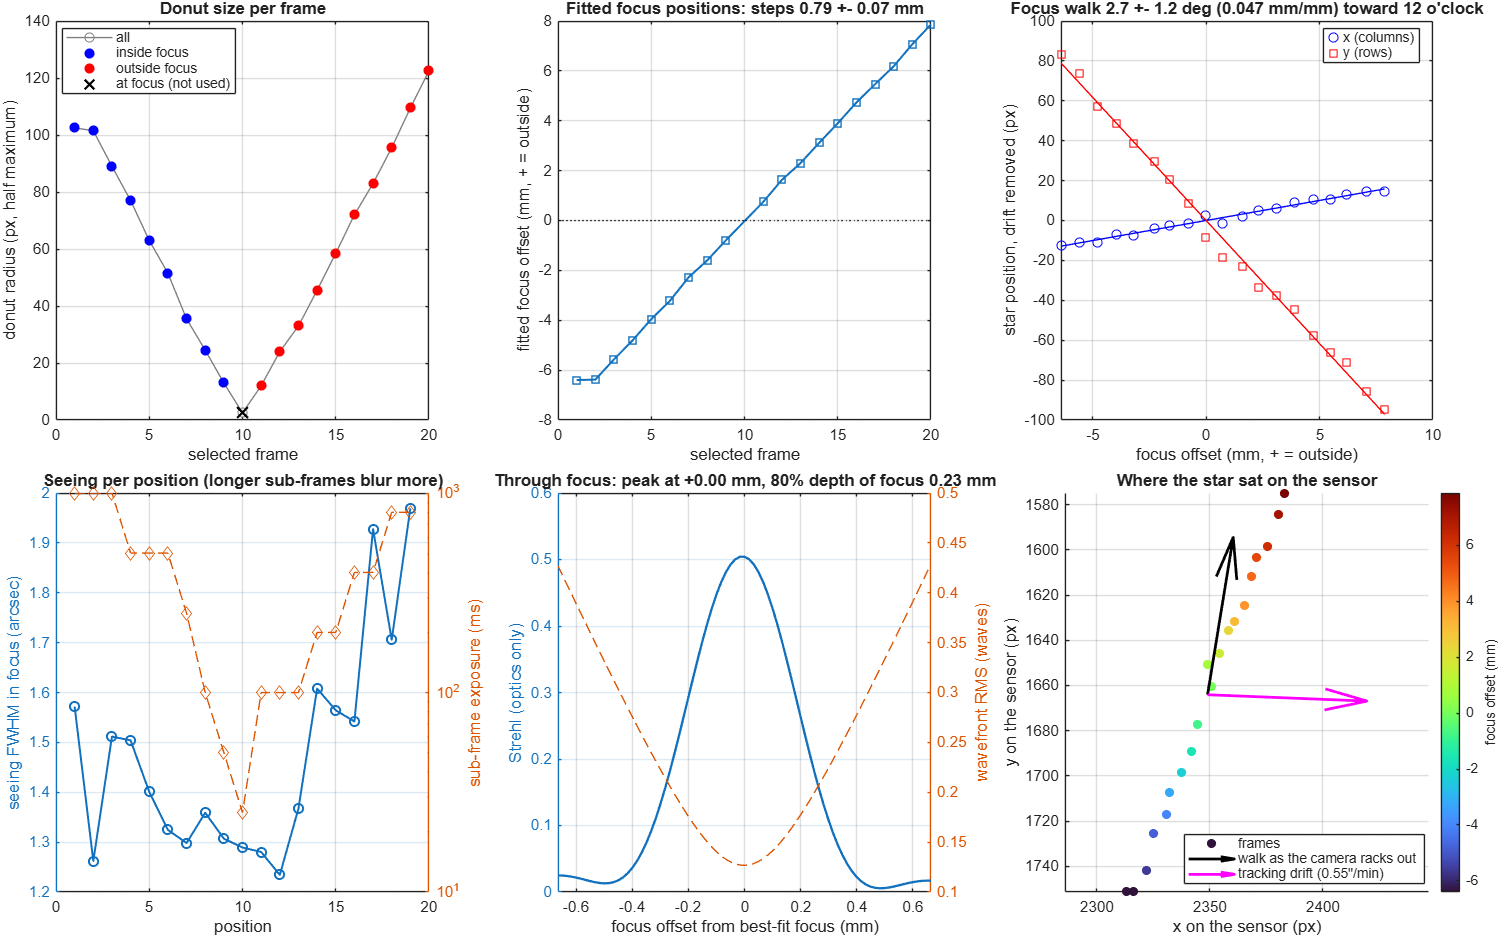
The exact focus position of every image, how far the star walks sideways per millimeter of focus, the mount’s tracking drift, the focuser’s backlash, and the true focal length.
Your telescope, remembered
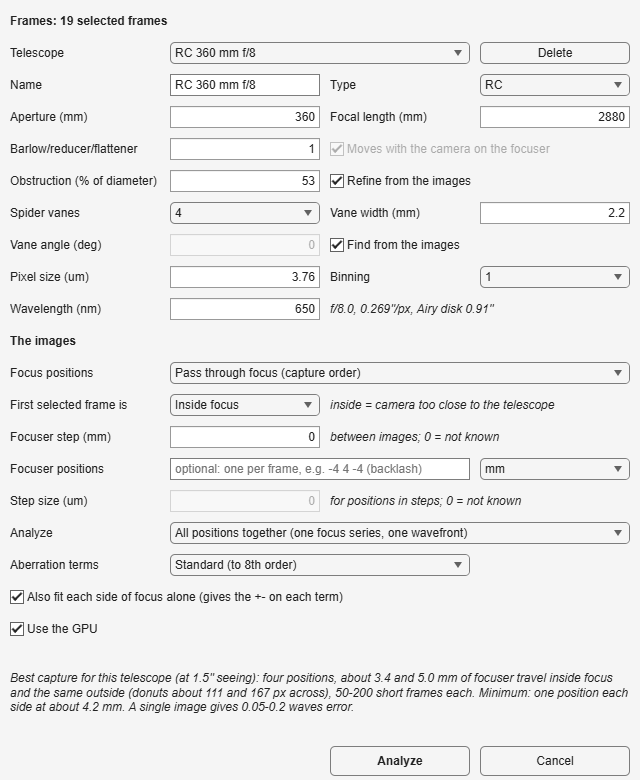
Enter a telescope once — aperture, focal length, any Barlow, reducer or flattener, obstruction, spider, pixel size, filter — and pick it by name next time. A focus series measures the obstruction and spider angle for you and saves them.
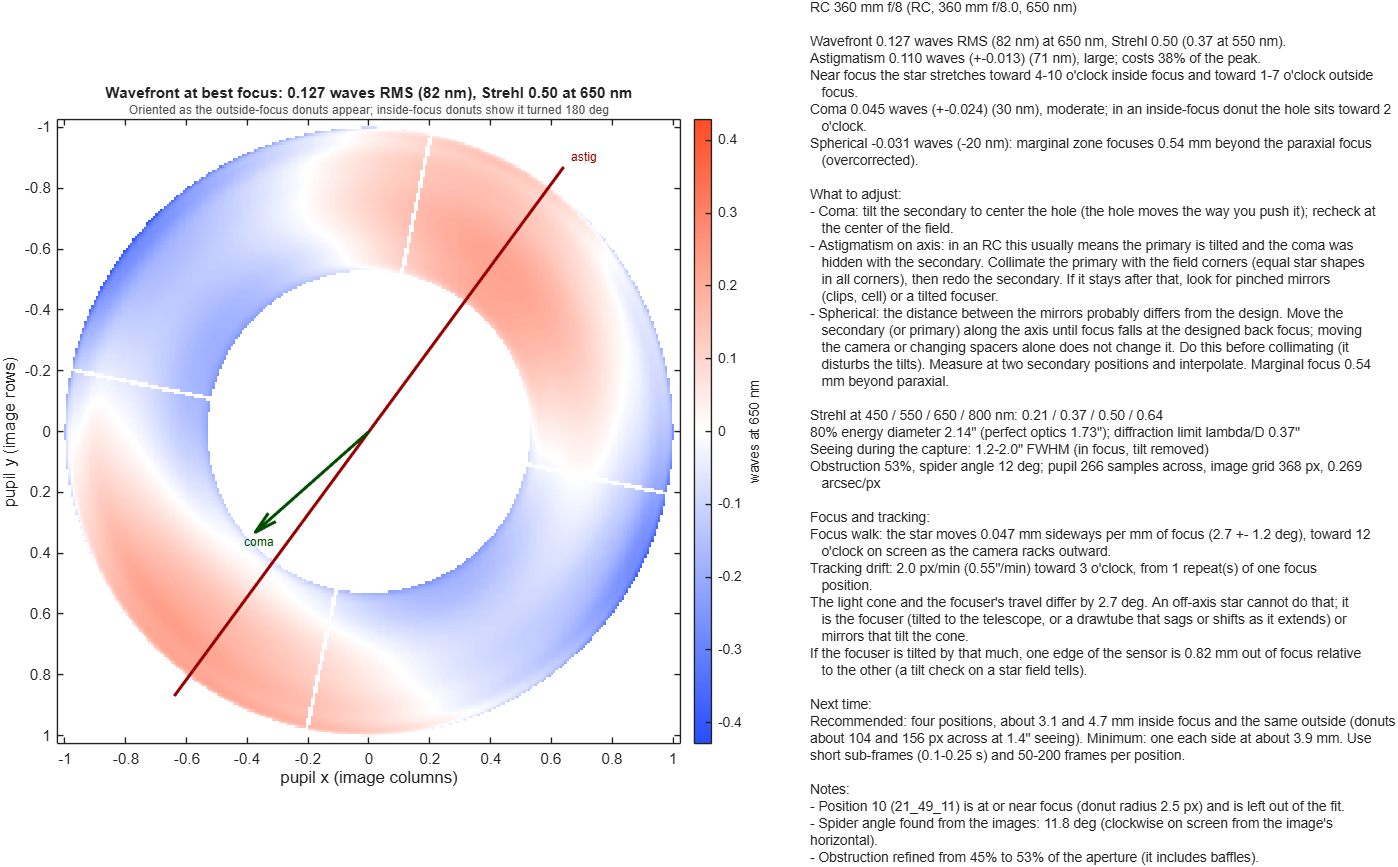
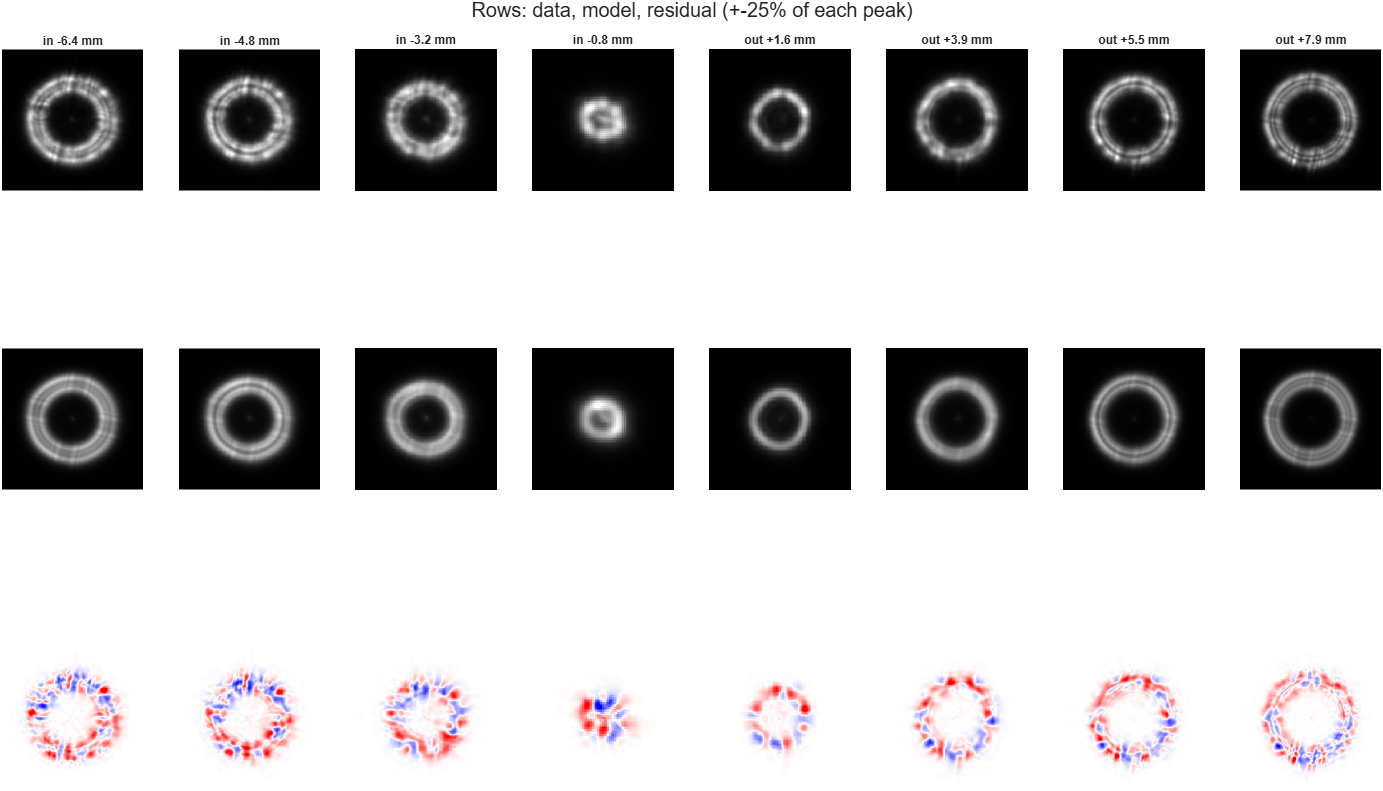
A 360 mm f/8 Ritchey–Chrétien
Twenty stacked images of one star, taken while racking the focuser through focus in 0.8 mm steps, with a red filter and an ASI1600MM (3.8 µm pixels).
What it told us
Astigmatism is the error worth fixing: on its own it holds the Strehl to about 0.6, and removing it would take the system from 0.50 to about 0.8 at 650 nm. It changed between sessions and is about five times what the mirrors showed on the maker’s interferometer (0.033 waves RMS, Strehl 0.96), so it comes from alignment or mounting, not the polish. The spherical aberration is about 3.5 times the bench value, which points at the distance between the mirrors.
How far to trust it
We refitted parts of the series against the whole of it. One inside and one outside image agreed to 0.03–0.05 waves; two of each to 0.02–0.04; a single image only to 0.06–0.2. A single-image fit of the same data by another commercial tool gave the same overall RMS to within 0.001 wave — but a single image cannot say reliably how that error divides between astigmatism and coma.
Two positions each side of focus
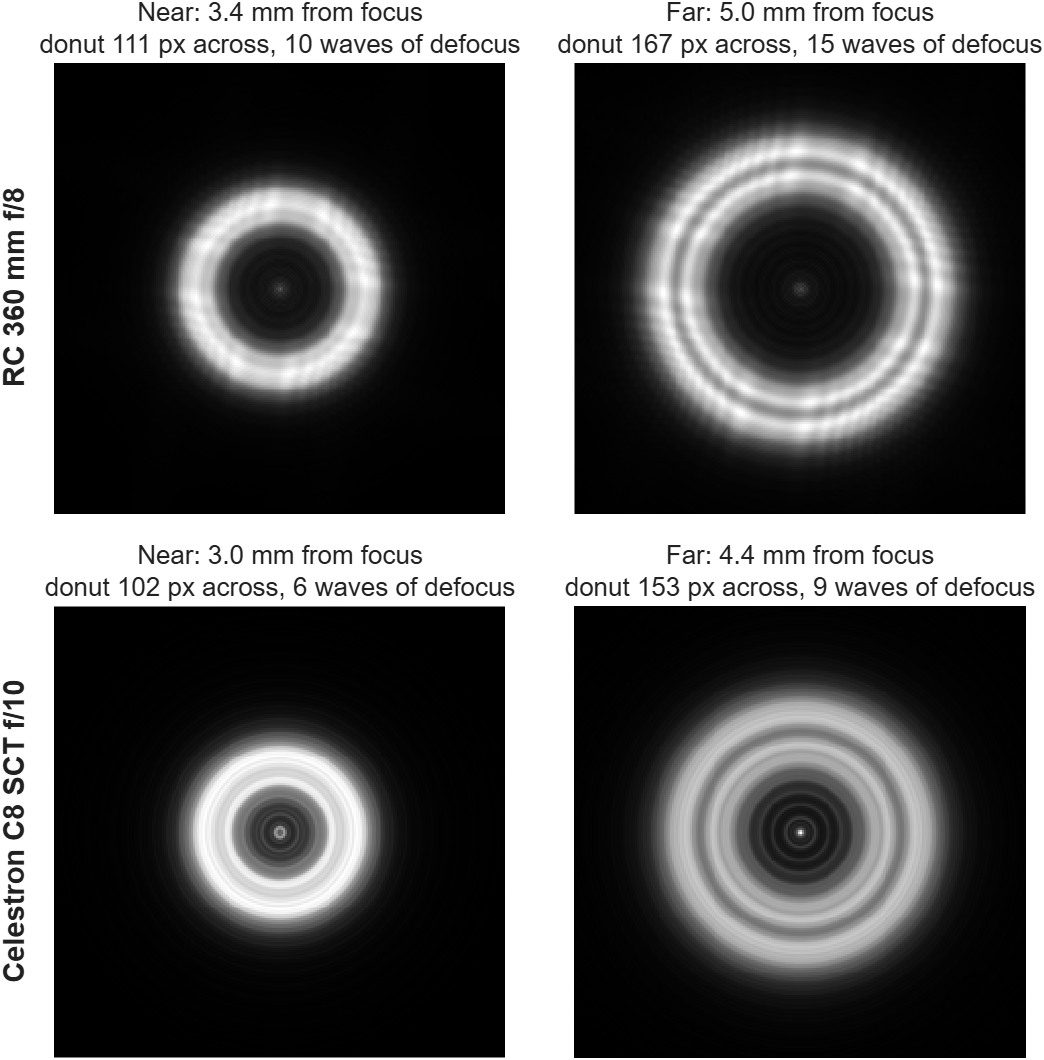
The best images have donuts about 20 and 30 times the blur across — the blur being the seeing, or two pixels if your pixels are coarser than that — taken on both sides of focus.
Pick a bright star near the zenith
High in the sky, away from the Moon, and put it in the center of the frame. Use the optics you image with; a Barlow, reducer or flattener is part of what gets measured, so enter its factor with the telescope.
Use a filter and short frames
A red or near-infrared filter steadies the seeing; enter its center wavelength. Use 0.1–0.25 s sub-frames and stack 50–200 at each position, or record a short video — BiggSky averages the frames of one position for you. Don’t saturate the ring.
Rack in, then out
Inside focus means the camera is too close to the telescope. Take the near and far positions inside, pass through focus, then the same distances outside. The amounts do not need to be exact or equal.
Finish where you started
Go back to the first position for one last image. That lets BiggSky tell the mount’s drift from the focus walk, and measures the focuser’s backlash if you enter its positions.
How far from focus, for your telescope
Enter your telescope and camera. The distances are focuser travel, measured from focus.
- Telescope
- …
- Recommended
- … and … inside and outside focus
- Donuts
- …
- Minimum
- …
- Not closer than
- …
- Not farther than
- …
- Defocus in waves
- …
These are the starting points the tool itself suggests. Any position in the range works; BiggSky measures the real one.
Typical telescopes, at 1.5″ seeing
| Telescope | Camera pixels | Near | Far | Donuts |
|---|
Focuser travel from focus, inside and outside. Donut diameters in camera pixels.
Functions › Wavefront and Collimation
Add the images to a dataset, select the frames, and choose the telescope. Three ways to analyze them:
All positions together
One wavefront from a whole focus series — the most accurate, and the one that measures the obstruction, focal length, focus walk and backlash. Use it to check a telescope, or after you finish collimating.
Pairs
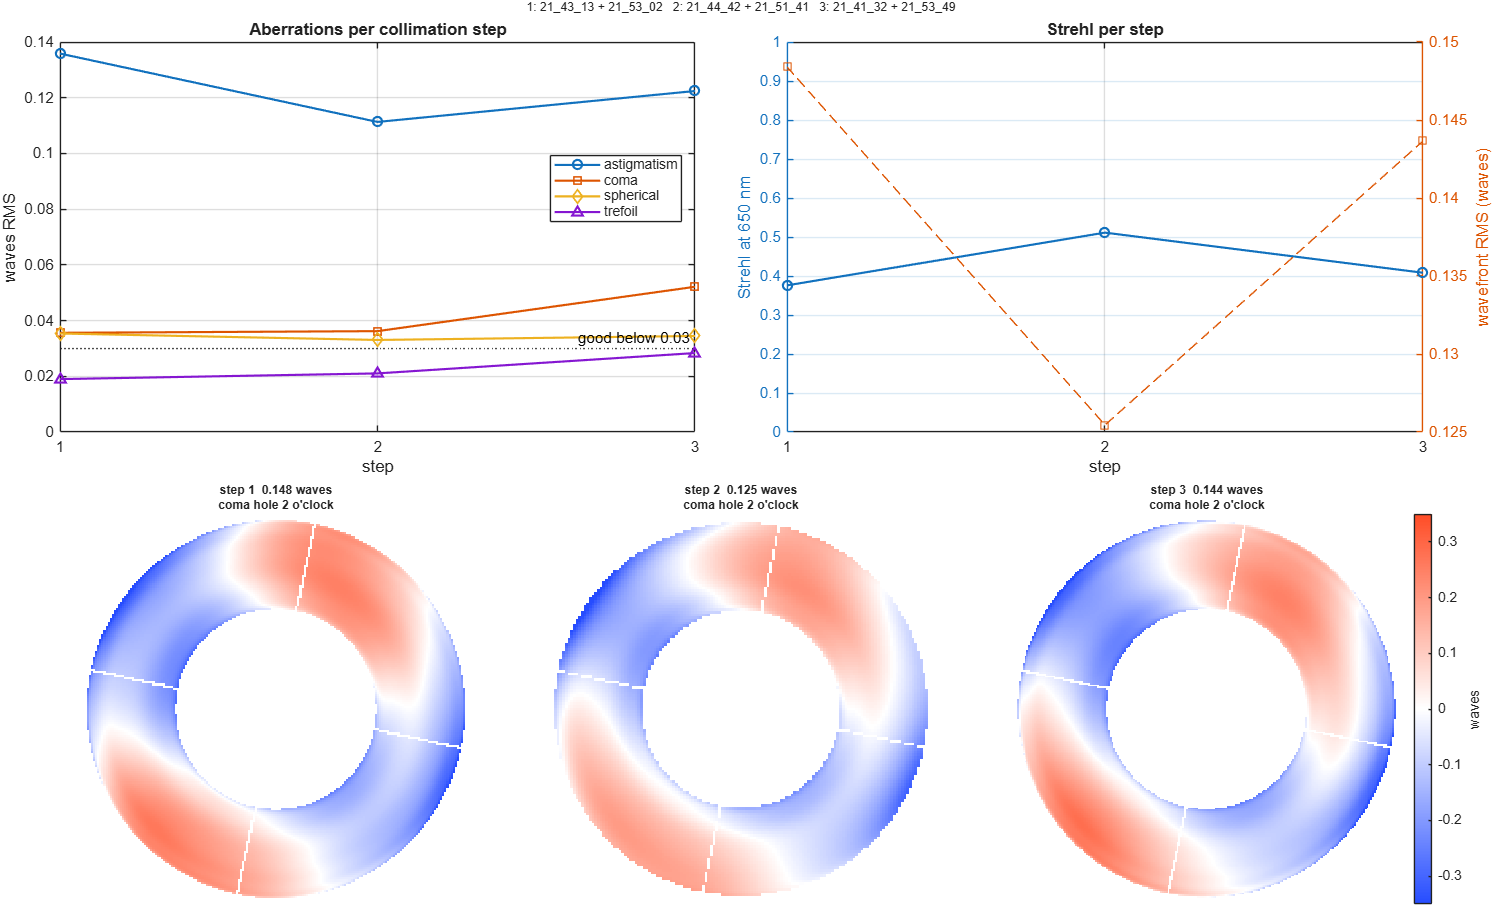
One inside and one outside image per adjustment. Each pair is fitted on its own and the Steps tab charts astigmatism, coma and Strehl as you go — the way to collimate. Good to about ±0.03–0.05 waves per step.
Each position separately
One image per adjustment, for the quickest check. Watch the trend from step to step; a single image cannot be trusted on its own to better than 0.05–0.2 waves.
| SSE Pro, DSO, Universe | The full analysis: all three modes, the Zernike table and CSV, PSF/MTF/encircled energy, the interferogram and zonal profile, focus walk, tracking drift, backlash and focal length, and the saved result. |
|---|---|
| SSE Lite | The collimation check: Pairs and Each position, with the Steps tab and a summary of the wavefront, Strehl, coma, astigmatism and what to adjust. |
| Free | Not included. |
Spacing first, then tilt
For a Ritchey–Chrétien or Cassegrain, in this order. After each adjustment, take a pair — about the recommended distance inside and outside — and run Pairs.
Mirror spacing
Spherical aberration depends only on the distance between the mirrors. Moving the camera or changing spacers changes where you focus, not the spherical. Move the secondary along the axis until focus falls at the designed back focus; measure the spherical at two secondary positions and interpolate. Do this first, because moving a mirror along the axis disturbs its tilt.
Secondary tilt for coma
Coma is the optical axis pointing off center. The summary says where the hole of an inside-focus donut sits; tilt the secondary to center it.
Primary tilt for astigmatism
Astigmatism on axis with little coma usually means the primary is tilted and the secondary has hidden its coma. Set the primary with star shapes in the field corners, then go back to step 2.
Repeat, then confirm
Alternate 2 and 3 until coma and astigmatism are both below about 0.03 waves, then take a full focus series and run All positions together to confirm.
One week with the 360 mm RC
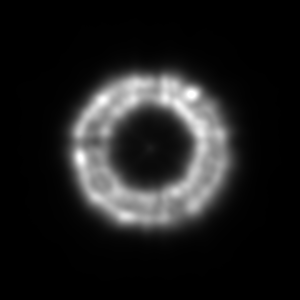
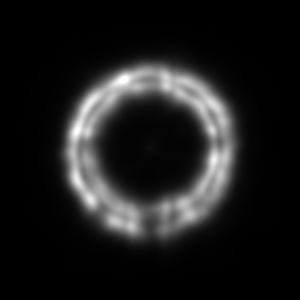
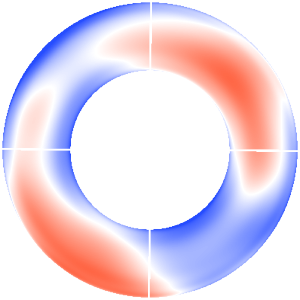
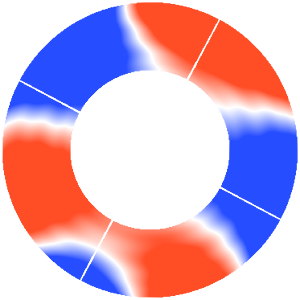
The telescope from the worked example, recollimated in the order above. Each row is one focus series analyzed with All positions together: two of its stacked images as recorded, and the wavefront at best focus. Every map uses the same color scale; Strehl is at 650 nm.
Mirrors too far apart
Spherical aberration: the mirrors were about 5 mm too far apart, and the back focus had shrunk to match.
Secondary pinched
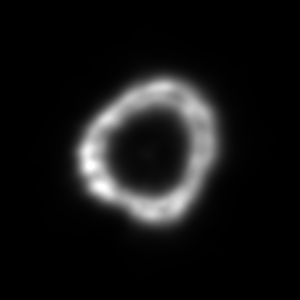
The secondary moved in to fix the spacing, but its lock and tilt screws were left tight: three-fold trefoil and astigmatism.
Spacing corrected
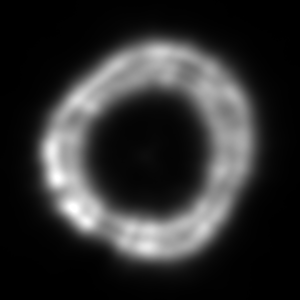
Lock and tilt screws eased: spherical, trefoil and astigmatism gone. What remains is coma from the secondary’s tilt.
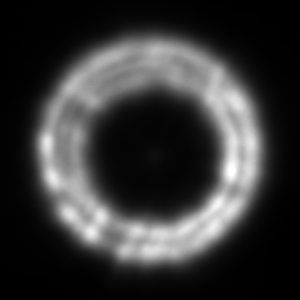
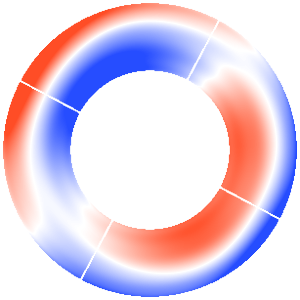
Secondary tilt corrected
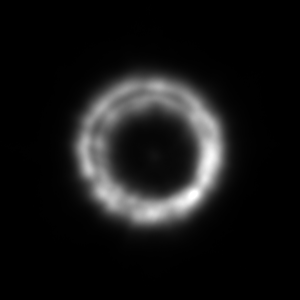
One tilt adjustment to center the donut hole.
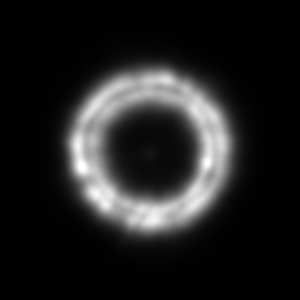
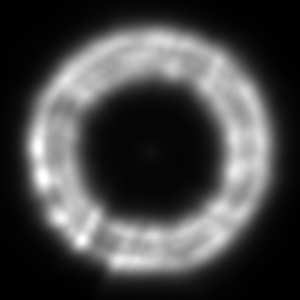
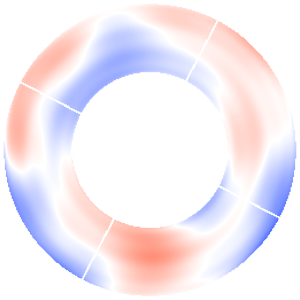
Still cooling
Two nights later, soon after dusk: astigmatism while the mirror is still warmer than the air.
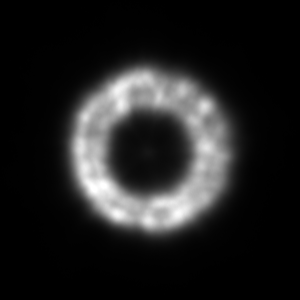
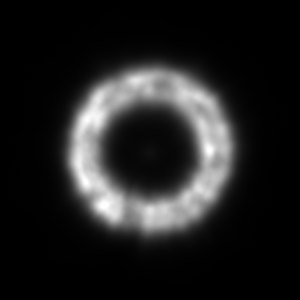
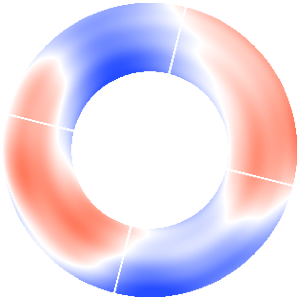
Cooled
Three hours later with nothing adjusted: the astigmatism has gone.
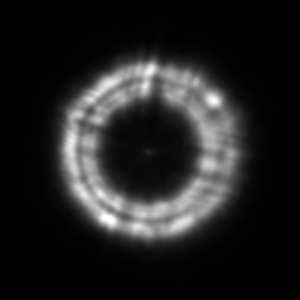
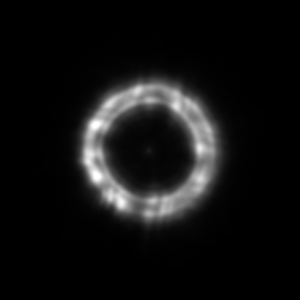
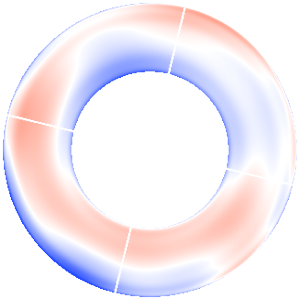

The pinched series runs well past the scale (±800 nm), and it was taken outside focus only, in 3.6″ seeing, so how it splits between trefoil and astigmatism is less certain than its total.
It also checks the focuser
Because BiggSky measures where each image really was to a few hundredths of a millimeter, it can check the mechanics too.
Focus walk
If the star slides sideways as you focus, the light cone and the focuser’s travel are not parallel: a tilted focuser, a drawtube that sags as it extends, or mirrors that tilt the cone. BiggSky gives the angle and direction, and how far out of focus one edge of the sensor would be if the focuser were tilted that much.
Tracking drift
A series run one way through focus moves time and focus together, so the mount’s drift looks like focus walk. Returning to one focus position later separates them; without that, BiggSky reports the combined motion and says so.
Backlash and focal length
Enter the focuser’s position for each frame and approach one position from both directions — in to −4, out to +4, back to −4 — and BiggSky reports the backlash, how closely the focuser follows its steps, and the telescope’s true focal length.
What it cannot do
A star test through the atmosphere is not an interferometer on a bench. These are the limits we measured or know about.
One image is not enough
A single image gets the overall error right but cannot reliably divide it between astigmatism, coma and the rest: on our test the split moved by up to 0.08 waves depending on how it was fitted. Use pairs or a series for anything you will act on.
One side of focus is biased
Images all inside or all outside focus mix spherical aberration and astigmatism with uneven illumination. The obstruction is measured only from images on both sides.
Seeing sets the resolution
Seeing blurs the fine detail, so the map shows the broad shape of the wavefront — the terms up to 8th order (10th with High) — not fine polishing zones. Fine mottling in the donuts that repeats from night to night behaved like uneven reflectivity or dust, not a figure error, and is not reported as one.
The whole optical train
The measurement covers everything the light passes through: mirrors, corrector, filter, camera window and the air in the tube. Tube currents look like optical errors, so let the telescope cool. It is the image the camera sees, not the bare mirror.
Your numbers set the scale
The focal length and pixel size you enter set the scale of the analysis. A 5% error in focal length shifts the results by about 5%. The images alone cannot measure the focal length through the seeing; a known focuser step or positions can, and so can a plate solve.
Near the center of the field
It measures the telescope where the star is. Put the star near the center for on-axis collimation; off-axis aberrations of the design are not separated from misalignment.
Directions are on your screen
Coma and astigmatism are given as directions in the image as BiggSky shows it. Which screw that is depends on how your camera is turned on the focuser — note its angle.
A GPU helps
A twenty-image series takes 4–6 minutes on a modern NVIDIA GPU and roughly ten times as long on the processor; a pair takes under a minute on the GPU. Saturated pixels bias the fit and are flagged.
Phase diversity, fitted to every pixel
Each image is modeled as the diffraction pattern of the telescope’s aperture — the obstruction and the spider vanes included — with the wavefront error, the image’s own defocus and tilt, the seeing during that image (with the frame-to-frame jitter removed, as a stack has it) and the camera’s pixels. The wavefront is shared by all images; everything else belongs to each one. BiggSky adjusts them all together until the model matches the recorded stars pixel by pixel, using the exact derivatives of the model, on the GPU when there is one.
Images at different distances from focus see the same wavefront through different amounts of defocus, which is what pins it down — and why one image, which sees it only one way, cannot. The obstruction and the angle of the spider are measured the same way, by finding the values that make the model fit best.
Enough terms matter as much as enough images: fitting too few lets the unmodeled ones leak into the rest. On the test telescope, stopping at the primary aberrations read astigmatism as 0.04 waves; with terms to 8th order it settled at 0.10, and adding more changed nothing. BiggSky always fits to at least 8th order.
Try it on your telescope
Wavefront and Collimation is in BiggSky SSE Pro, DSO and Universe, with the collimation check in SSE Lite.